The arctan graph represents the inverse of the tangent function, showing the relationship between tangent values and their corresponding angles. The arctan function, written as y = arctan x or y = tan⁻¹x, gives the angle whose tangent is x.
Because the tangent function is not one-to-one over its full domain, the arctan graph is restricted to produce a single continuous curve. This restriction ensures the graph accurately maps all x-values to a unique angle in the range (-π/2, π/2).
Table of Contents
Key Features of the Arctan Graph
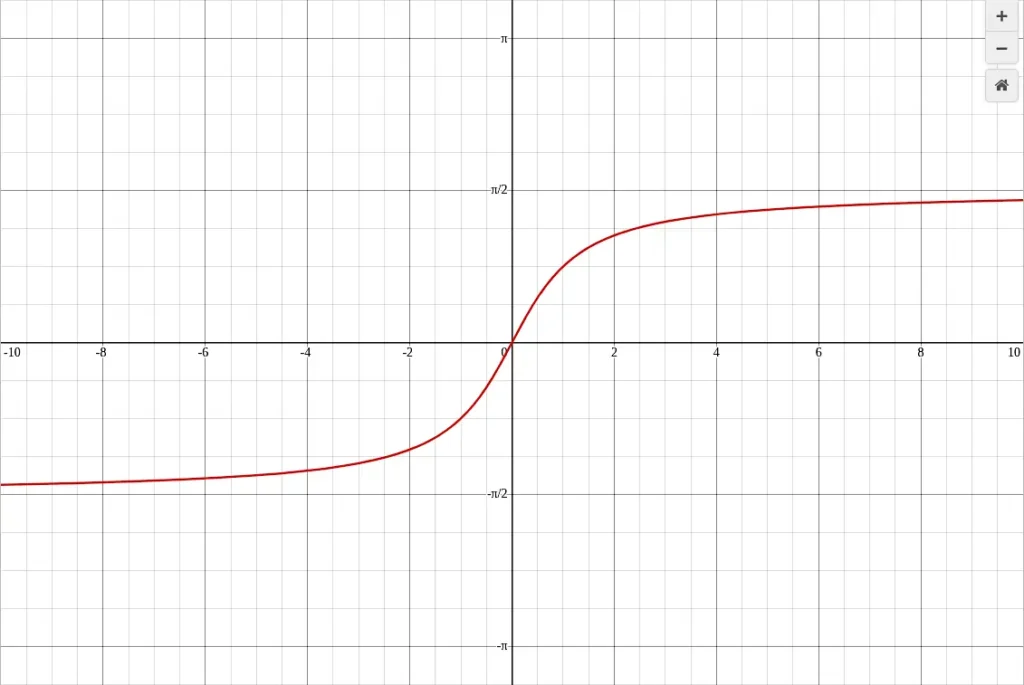
The arctan graph is a distinctive inverse trigonometric function that displays the angle corresponding to a given tangent value. Unlike the tangent graph, which has vertical asymptotes and repeats periodically, the arctan graph is continuous and smooth, steadily increasing from left to right. It has horizontal asymptotes at y = -π/2 and y = π/2, indicating the maximum and minimum angles it can output.
These features make it especially useful in applications requiring bounded angles, such as engineering, physics, and computer graphics. The arctan graph is unique among inverse trig graphs because it extends infinitely in the x-direction while approaching horizontal limits.
The table below highlights the domain, range, intercept, monotonic behavior, and overall shape, giving a quick reference for students and professionals who want to understand how the graph behaves across all real x-values. This concise view makes it easier to anticipate the graph’s trends and to use it for calculations or graphing exercises.
| Property | Description |
|---|---|
| Domain | All real numbers (-∞, ∞) |
| Range | -π/2 < y < π/2 |
| Intercept | (0, 0) |
| Increasing? | Yes, the function increases continuously from left to right |
| Shape | Smooth S-shaped curve with horizontal asymptotes at y = -π/2 and y = π/2 |
How to Graph an Arctan Graph Step-by-Step
Graphing the arctan function can be straightforward when broken down into key steps. Start by identifying essential points such as arctan 0, arctan 1, and arctan 2. Next, mark the horizontal asymptotes at y = ±π/2 to define the curve’s vertical boundaries. Adding additional points, especially for negative x-values, ensures symmetry and accuracy. Finally, connecting these points with a smooth S-shaped curve gives a clear visual of the function’s behavior. Following these steps allows for a precise representation of the arctan graph for any real number input.
- Identify key points:
- arctan 0 = 0 → (0, 0)
- arctan 1 = π/4 → (1, π/4)
- arc tan 2 ≈ 1.107 → (2, 1.107)
- Mark horizontal asymptotes:
Draw dashed lines at y = π/2 and y = -π/2 to indicate the limits the curve approaches but never crosses. - Plot additional points:
Include negative x-values for symmetry:- arctan -1 = -π/4 → (-1, -π/4)
- arctan -2 ≈ -1.107 → (-2, -1.107)
- Draw a smooth curve:
Connect the points with a continuous, increasing S-shaped curve that flattens near the asymptotes.
This process ensures a precise visualization of the arctan graph and its behavior for all real inputs.
How to Graph an Arctan Graph Using Desmos
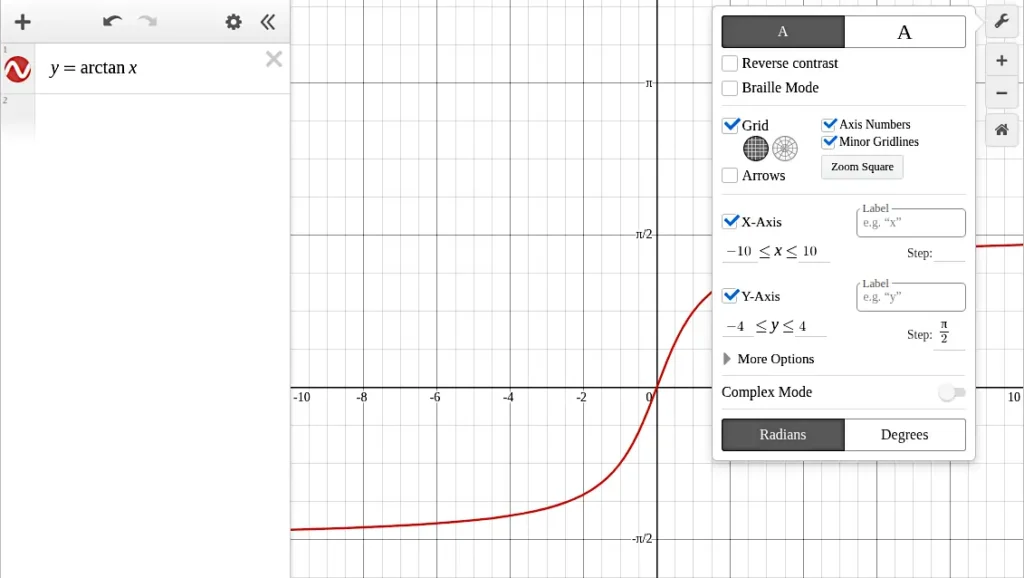
Desmos offers an intuitive way to graph the arctan function quickly and accurately. By entering y = arctan(x) into the calculator, you can instantly see the characteristic S-shaped curve. Adjusting the y-axis range to cover approximately -2 to 2 or using π/2 as a reference helps to visualize the asymptotes and the function’s gradual leveling. Using Desmos also allows zooming in on key points, checking coordinates, and experimenting interactively, which is especially helpful for students who are learning the behavior of inverse trigonometric functions.
To graph the arctan function in Desmos:
- Open Desmos Graphing Calculator
- Enter
y = arctan(x)into the input box. - Set the y-axis range from -2 to 2 to visualize the curve relative to π/2 ≈ 1.57. Or set the y-axis range from -4 to 4 to make PI visible on the y-axis.
- Use π/2 for the y-axis step value.
This interactive method allows for zooming and adjusting to fully explore the arctan chart visually. The following image shows the graph in Desmos.
Common Mistakes When Graphing the Arctan Graph
When graphing the arctan function, students often make mistakes that distort the curve. One frequent error is ignoring the horizontal asymptotes at y = ±π/2, which leads to overextending the graph vertically. Another common mistake is plotting key points incorrectly, such as miscalculating arctan 1 or arc tan 2. Additionally, some learners forget that the graph extends infinitely along the x-axis, causing them to plot only a few points and misrepresent the function’s gradual slope. Being aware of these pitfalls helps create a more accurate graph.
- Ignoring horizontal asymptotes: The curve approaches y = ±π/2 but never crosses them.
- Incorrect key points: Ensure arctan 1 = π/4, arctan 0 = 0, and arc tan 2 ≈ 1.107 are plotted accurately.
- Forgetting domain coverage: The arctan graph extends infinitely along the x-axis, so plotting only a few points may misrepresent its shape.
Tips for Graphing the Arctan Graph
To graph the arctan function effectively, label the axes clearly with radians. Include extra points at intermediate x-values like ±0.5, ±2, and ±3 to capture the curve’s gradual S-shape. Use the horizontal asymptotes as guides to prevent overextending the curve, and check your work against an arctan chart for accuracy. Additionally, sketching lightly at first allows adjustments before finalizing the curve, ensuring the graph represents the continuous, steadily increasing behavior of the function.
- Always label the axes with radians for consistency in trigonometry.
- Plot additional points at x = ±0.5, ±2, and ±3 to better visualize the curve’s S-shape.
- Use the horizontal asymptotes as guides to prevent overextending the curve.
- Compare your sketch with an arctan chart to ensure accuracy.
Did You Know?
The arctan graph has horizontal asymptotes because the tangent function grows without bound, making its inverse approach a fixed limit. Historically, mathematicians used the arctan function to calculate angles in navigation and astronomy, long before calculators existed. Today, it remains essential in calculus, physics, and engineering for modeling angles and slopes.
Arctan also plays a key role in trigonometric identities and integral calculus. For example, the derivative of arctan(x) is 1/(1 + x²), making it a frequent choice in calculus problems involving integration and slope determination. Its inverse relationship with tangent means it can be used to solve real-world angle problems in construction, robotics, and signal processing.
Additionally, arctan is commonly used in programming and computer graphics to convert ratios of sides into angles, often when determining rotations or orientations. This makes understanding the graph not just an academic exercise, but a practical tool for engineers and developers alike.
Related Graph Types to Explore
Exploring the arctan graph in context with other inverse trigonometric functions deepens understanding of how angles and ratios relate. By studying arcsin and arccos alongside arctan, learners can see how each function’s range and domain affect its graph. Additionally, comparing arctan with the original tangent graph shows the reflection across y = x, reinforcing the concept of inverse functions and highlighting differences in asymptotic behavior.
These tutorials help students understand the relationships between trigonometric functions and their inverses.
- Arcsin Graph Explained: How to Understand and Sketch the Inverse Sine Function
- Arccos Graph Explained: How to Understand and Sketch the Inverse Cosine Function
- Tangent Graph Made Simple: Learn How to Graph tan x
Frequently Asked Questions About Arctan Graph
What is the domain and range of the arctan graph?
Domain: all real numbers (-∞, ∞). Range: -π/2 < y < π/2. The domain of the arctan graph includes all real numbers, meaning you can input any x-value and get a corresponding angle. Its range is limited to -π/2 < y < π/2, which ensures that each input corresponds to a single, unique output angle. This restriction prevents ambiguity that would arise if multiple angles had the same tangent value, making the function a true inverse of tangent over its restricted domain.
What does arctan 1 equal?
arctan 1 equals π/4 radians, or 45 degrees. This is because the tangent of π/4 is exactly 1. Knowing this key point is important when plotting the arctan graph, as it provides a reference for the slope and curvature of the function around the origin.
What does arctan 0 equal?
arctan 0 equals 0 radians because the tangent of 0 is 0. This point serves as the origin of the arctan graph and is a central reference for plotting the rest of the curve. Its symmetry around the origin also helps in sketching the function accurately for negative x-values.
What is arc tan 2?
arc tan 2 is approximately 1.107 radians. This value comes from solving the equation tan(y) = 2. Plotting this point helps capture the curve’s gradual increase as x moves away from the origin, giving a realistic view of the S-shaped graph.
How does the arctan graph relate to the tangent graph?
The arctan graph is the reflection of the restricted tangent graph across the line y = x. By restricting the tangent function to -π/2 < y < π/2, each tangent value has a unique corresponding angle, making the reflection possible. Observing this relationship helps in understanding inverse functions and predicting how the graph behaves compared to the original tangent curve.
Can I use an arctan chart to check my graph?
Yes, using an arctan chart is an effective way to verify your plotted points and ensure the curve’s accuracy. These charts provide precise x-to-angle correspondences, making it easier to confirm key points like arctan 1, arctan 0, and arc tan 2. They are particularly useful when sketching by hand or when learning the general shape and asymptotic behavior of the function.
Conclusion
The arctan graph provides a clear visualization of the inverse tangent relationship. By understanding key points like arctan 0, arctan 1, and arc tan 2, plotting asymptotes, and using tools like Desmos or an arctan chart, you can accurately draw the arctan function and deepen your understanding of inverse trigonometric functions.