When someone searches for “graph of x 1”, it usually means they want to understand the graph of the equation x = 1, that is the, the graph of x = 1. Beginners often type the phrase without the equals sign, which can make the search term look confusing. However, the mathematical meaning is clear:
x = 1 describes a vertical line on the coordinate plane.
In this guide, you learn what the graph of x = 1 looks like, how to draw it, why it isn’t a function, and how to interpret related equations students often confuse with this one.
Table of Contents
- What Does "Graph of x 1" (Graph of x = 1) Mean?
- How to Graph x = 1
- Visual Example of Graph of x = 1
- Worked Examples, Common Mistakes, and Real Problem Context
- Graph of x = -1
- Why Is x = 1 Not a Function?
- Why Vertical Lines Break the y = mx + b Pattern
- Other Possible Interpretations of "Graph of x 1"
- Where the Graph of x = 1 Fits in the Math Curriculum
- Frequently Asked Questions (FAQ) on the Graph of x = 1
- Is x = 1 a function?
- What does the graph of x = 1 look like?
- How is x = 1 different from y = 1?
- How do I graph x = 1 in Excel or Desmos?
- Is x = 1 a linear equation?
- What does the graph of x = 1 look like?
- Why does x = 1 have no slope?
- How does x = 1 appear in exam questions?
- Can x = 1 be part of a system of equations?
- Final Thoughts on the Graph of x = 1
What Does “Graph of x 1” (Graph of x = 1) Mean?
The most common and accurate meaning of the phrase “graph of x 1” is:
The graph of the equation x = 1
This equation does not describe a typical “y = …” line. Instead, it describes all points whose x-coordinate is always 1, no matter what the y-value is. Because the x-value does not change, the graph is a straight vertical line crossing the x-axis at x = 1. Understanding that x is fixed is the key to recognizing this type of graph. See the next section below for an image of the graph of the equation x = 1.
How to Graph x = 1
The equation x = 1 means that no matter what value y is, the value of x is always 1. As a result, this forms a vertical line that passes through the point where x = 1 on the x-axis. How to graph this equation and the key features of this type of graph follow below.
Graph of x = 1 Step-by-Step
This graph is actually very simple to draw. The trick is to remember that it is different from other line graphs that usually have a slope. Just memorize this exception to most other line graphs. Follow these steps to easily draw the graph of x = 1.
- Draw a coordinate plane (x and y axes).
- Find x = 1 on the x-axis.
- Draw a straight, vertical line through x = 1.
- Extend the line upward and downward to cover the full graph.

That’s the graph of x = 1 and is shown in the image. Yes, it is that simple. The problem comes if you don’t remember it and then get confused during a test or exam. Don’t miss out on drawing this easy graph in a test or exam by forgetting how simple it actually is.
Key Features of Graph of x = 1
Here are some of the key features that characterize this type of graph. These details help students understand the behavior of vertical lines in algebra and why they behave differently from typical linear functions.
- The graph is a vertical line.
- It goes through points like (1, 0), (1, 2), (1, -3), and all other possible y-values.
- The line has no slope (its slope is undefined).
- The equation does not represent a function because it fails the vertical line test.
- The graph divides the coordinate plane into two regions: one where x < 1 and one where x > 1.
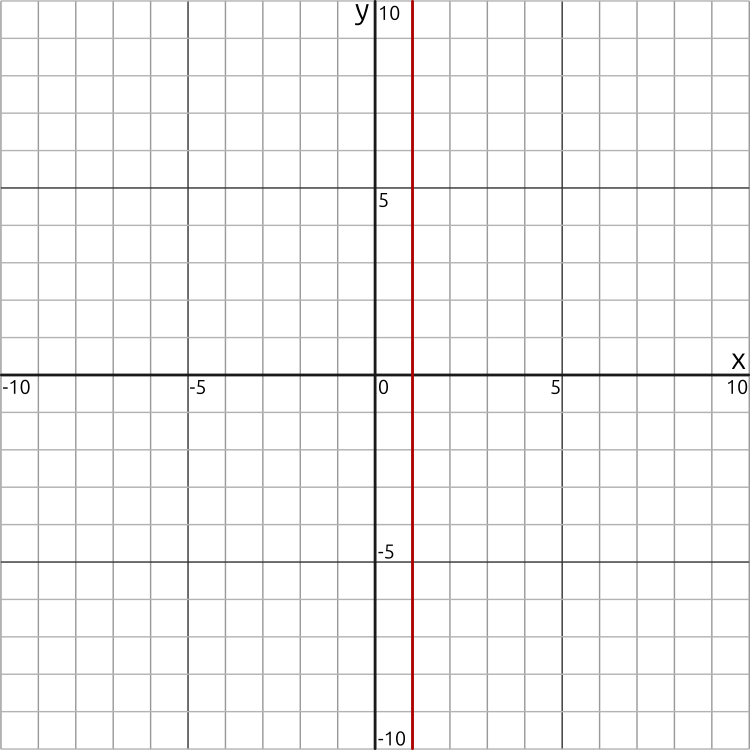
Visual Example of Graph of x = 1
The graph of x = 1 shows a vertical line passing through the point (1, 0). This line continues infinitely upward and downward. If you use graphing tools such as Desmos, GeoGebra, or a TI calculator, simply typing x = 1 instantly produces this vertical line.
Many students find vertical lines harder to visualize than slanted lines because they don’t follow the formula y = mx + b. However, seeing the graph makes it clear that this equation locks x in place while allowing y to range freely. Below is an image of the graph of the equation x = 1, and a second image of the graph plotted using the Desmos. Click either graph to see a bigger image.

Worked Examples, Common Mistakes, and Real Problem Context
Before working through individual examples, it helps to recognize that equations like x = 1 behave very differently from the linear functions students usually encounter first. Instead of describing how one variable depends on the other, this type of equation places a restriction on position.
The following examples and explanations focus on building intuition by showing how x = 1 appears in calculations, real situations, and common classroom problems, while also highlighting where learners often go wrong and how to avoid those mistakes.
Worked Example 1: Plotting x = 1 Using a Table of Values
Even though x = 1 is not written in the usual y = … form, you can still graph it using a table.
Choose several y-values and keep x fixed at 1:
| x | y |
|---|---|
| 1 | −2 |
| 1 | 0 |
| 1 | 3 |
| 1 | 5 |
Plot these points on the coordinate plane. All of them line up vertically because the x-value never changes. When you connect them, you get a straight vertical line passing through x = 1.
This method helps students who are more comfortable working with tables than with abstract equations.
The following image shows the above points from the table plotted using Desmos graphing software. Each plotted point falls on the straight line graph, as the image shows.

Worked Example 2: Identifying x = 1 in a Word Problem
Word problems often describe a situation indirectly, without stating the equation upfront. In these cases, the key is to identify which quantity is fixed and which is allowed to vary. When a description emphasizes a constant horizontal position, distance, or input value, it is often pointing toward an equation of the form x = constant. Recognizing this pattern makes it easier to translate real-world descriptions into a graph before performing any calculations.
Problem:
A security camera records activity along a hallway that is exactly 1 meter from a reference wall. How can this be represented on a coordinate grid?
Explanation:
Every position along the hallway has the same horizontal distance from the wall, but the vertical position can change. This situation is modeled by the equation:
x = 1
The graph shows all possible locations along that hallway as a vertical line. This kind of modeling appears in coordinate geometry and basic physics problems.
Common Student Mistakes With the Graph of x = 1
Many mistakes with x = 1 come from applying familiar rules in situations where they no longer work. Because students are heavily trained to rewrite equations into slope-intercept form, they may assume every straight line can be treated the same way. This subsection focuses on identifying those instinctive errors early, so learners can develop a more flexible understanding of how different equations behave on the coordinate plane.
Mistake 1: Trying to solve for y
Students often attempt to rewrite x = 1 as y = something. This is not possible because y is unrestricted.
Mistake 2: Drawing a horizontal line
Some learners confuse x = 1 with y = 1. Remember:
- x = constant → vertical line
- y = constant → horizontal line
Mistake 3: Assigning a slope value
A vertical line does not have a slope. Dividing by zero is undefined, which is why slope does not exist here.
Decision Guide: Is It a Vertical Line or Not?
When students are unsure how an equation will look when graphed, a short decision process can prevent unnecessary trial and error. By focusing on which variable is fixed and which one changes, it becomes possible to classify the graph almost instantly. This approach also explains why vertical lines fail the vertical line test: a vertical line assigns multiple y-values to the same x-value, meaning a single input corresponds to more than one output. Since functions require exactly one output for each input, vertical lines cannot represent functions.
Use this quick checklist:
- Is x fixed to one number? → Vertical line
- Is y fixed to one number? → Horizontal line
- Is y written in terms of x? → Likely a function
If the equation tells you x cannot change, the graph will always be vertical.
Graph of x = -1
Similar to a graph of x = 1, a graph of x = -1 is also a vertical line, but it passes through -1 on the x axis, as the following image shows. Drawing this graph is simply a matter of finding -1 on the x axis and drawing a straight vertical line through this -1 point on the x axis. If you’re using graphing software, you can simply input x = -1 and it will display this line.
The equation x = –1 works exactly the same way as x = 1, except the line shifts to the left. Instead of passing through 1 on the x-axis, it passes through –1.
This means:
- The line is still vertical
- The x-value is always –1
- The y-value can be anything
- The slope is still undefined
Plotting this graph reinforces the idea that all equations of the form x = constant produce vertical lines. If you graph both x = 1 and x = –1, you’ll see two parallel vertical lines on opposite sides of the y-axis.

Why Is x = 1 Not a Function?
In mathematics, a function assigns exactly one y-value for each x-value. But for x = 1, there are infinitely many y-values. That’s why it is considered a relation, not a function. A function must assign one y-value for each x-value.
But for x = 1, the opposite happens:
- x only has one allowed value (1)
- y has infinitely many possible values
This violates the definition of a function. The vertical line test confirms this: if a vertical line touches the graph in more than one place, the graph is not a function. Since x = 1 is a vertical line, it touches itself everywhere, meaning it fails the test immediately. In math, equations like x = 1 are called relations, not functions.
Why Vertical Lines Break the y = mx + b Pattern
Most students are taught that straight lines follow the form:
y = mx + b
Vertical lines are the exception. To find slope, you divide change in y by change in x. For a vertical line:
- y changes
- x does not
That means you are dividing by zero, which is undefined. This is why vertical lines cannot be written in slope-intercept form and why they are not functions. They represent a different kind of relationship, one where input is restricted instead of output. Recognizing this early helps students understand why not every straight line is a function.
Other Possible Interpretations of “Graph of x 1”
Although x = 1 is the most common meaning, someone typing “graph of x 1” might be referring to something else. Let’s explore alternative interpretations and their meanings.
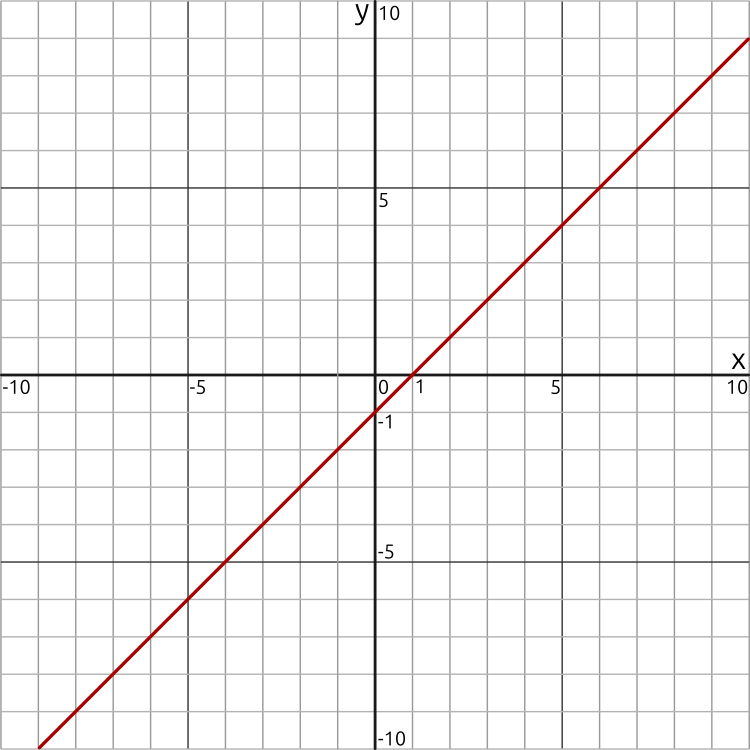
1. Graph of y = x + 1
This equation represents a linear function with a constant rate of change. Unlike x = 1, both variables are free to vary, and the graph shows how y increases as x increases. Introducing this comparison helps clarify that the presence of a “+1” does not automatically imply a vertical line; instead, it shifts a slanted line upward while preserving its overall direction and functional behavior. This is a common beginner equation and could be mistyped or simplified as “x 1”.
y = x + 1 is a linear function with:
- Slope: 1
- Y-intercept: 1
It graphs as an upward-sloping straight line that passes through points like (0, 1), (1, 2), and (2, 3). This is a very different graph from x = 1, as the following image shows, but beginners often confuse the two expressions. It is a form of the equation y = mx + b where m = 1, and b = 1. As a result, the equation ends up as y = 1x + 1 which is the same as y = x + 1.

2. Graph of y = x – 1
Although similar in form to y = x + 1, this equation shifts the line downward instead of upward. Examining both together helps students see how small changes in an equation affect position without changing the line’s slope. This contrast reinforces the idea that equations written in y = mx + b form always produce non-vertical lines and pass the vertical line test. It is another common linear equation that students encounter.
y = x – 1:
- Slope: 1
- Y-intercept: -1
This equation looks similar to y = x + 1, but its y-intercept is –1, so the line shifts downward. The following image shows the graph of this equation. Compare it to the previous graph.
3. Graph of the Point (x, 1)
Sometimes the notation is interpreted as a single ordered pair rather than an equation. In that case, the graph consists of just one point instead of a line. Understanding this distinction is important because a point does not describe a relationship or rule, it only marks a specific location on the plane, which behaves very differently from an equation defining infinitely many solutions.
This means that, “graph of x 1” may be interpreted as a coordinate point, like (x, 1), meaning any x-value where y equals 1. This represents a horizontal line described by the equation y = 1.
Someone may be referring to plotting a point where:
- x is a specific number
- y is 1
For example, (3, 1) is a single point, not a line or function.
4. Graph of the Function f(x) = 1
This form describes a function whose output is constant for all inputs. While it may look similar to x = 1 at first glance, the roles of the variables are reversed. Highlighting this contrast helps students better understand how fixing the output differs from fixing the input, and why one produces a horizontal line while the other produces a vertical one.
This is a constant function where the output is always 1, regardless of x. The graph is a straight, horizontal line that runs through y = 1 on the graph. It is a horizontal line crossing the y-axis at y = 1. It is the opposite of x = 1, which is a vertical line.
5. Graph of the Equation x + 1 = 0
Rewriting this equation reveals x = −1, which is another vertical line. Including this case shows that vertical lines do not always appear in their simplest form at first. Students learn that simplifying an equation is often necessary before graphing, especially when determining whether the result represents a function or a constraint.
If someone is solving an equation and wants to graph it, they may mean x + 1 = 0. Solving it gives: x = -1, which is a vertical line through x = -1.
Solving gives:
x + 1 = 0
x = –1
This means the graph is the same vertical line as x = –1 discussed earlier.
Where the Graph of x = 1 Fits in the Math Curriculum
This type of equation usually appears when students transition from basic plotting to a deeper study of relations and functions. It serves as an early example of a graph that breaks familiar rules, prompting discussion about domain, range, and function definitions. Teachers often use vertical lines like x = 1 to help students understand why mathematical definitions matter and how exceptions play an important role in building stronger conceptual foundations.
This concept is usually introduced in:
- Pre-algebra and Algebra I
- Early coordinate geometry units
- Introductory lessons on functions vs relations
Students typically encounter it when learning:
- How to graph equations that are not functions
- Why the vertical line test matters
- How constraints work in coordinate systems
From a teaching perspective, vertical lines are often the first example that forces students to move beyond memorized formulas and think about what an equation actually says.
This idea later reappears in:
- Systems of equations
- Inequalities (x ≥ 1)
- Graphing regions and boundaries
A solid understanding here prevents confusion in more advanced topics.
Frequently Asked Questions (FAQ) on the Graph of x = 1
Questions about x = 1 often reflect broader confusion about functions, slope, and graph interpretation. The answers in this section are designed to address those misunderstandings directly, using clear explanations rather than shortcuts. Each question builds on the idea that understanding why a graph behaves a certain way is more valuable than simply memorizing its appearance.
Is x = 1 a function?
No. A function must assign exactly one output to each input. In x = 1, the input does not vary, while the output can take infinitely many values. This violates the definition of a function and fails the vertical line test.
What does the graph of x = 1 look like?
It is a vertical line that intersects the x-axis at 1. Every point on the line has an x-value of 1 and a varying y-value.
How is x = 1 different from y = 1?
- x = 1 fixes the horizontal position and produces a vertical line
- y = 1 fixes the vertical position and produces a horizontal line
They are perpendicular to each other and represent different types of constraints.
How do I graph x = 1 in Excel or Desmos?
- In Desmos, type
x = 1into the input box and it will draw the vertical line. - In Excel, you can create a dataset where x = 1 and y takes several values. Plot these points using a scatter chart with lines.
Is x = 1 a linear equation?
Yes, but it is a special case. Linear equations typically have the form y = mx + b and produce sloped lines. x = 1 is still linear but forms a vertical line.
What does the graph of x = 1 look like?
It is a vertical line crossing the x-axis at 1. Every point on the line has the same x-value but a different y-value.
Why does x = 1 have no slope?
Slope is calculated as rise over run. For this line, the run is zero because x never changes. Dividing by zero is undefined, so the slope does not exist.
How does x = 1 appear in exam questions?
It often appears as:
- A boundary line in graphing inequalities
- A relation that must be classified as “not a function”
- A comparison question alongside y = mx + b lines
Understanding its properties saves time during tests.
Can x = 1 be part of a system of equations?
Yes. When combined with another equation, it can represent an intersection at a specific x-value. For example, solving x = 1 and y = 2 gives the point (1, 2).
Final Thoughts on the Graph of x = 1
The search for “graph of x 1” almost always refers to the equation x = 1, a simple yet important concept in early algebra. Understanding how to graph x = 1 helps build a strong foundation for learning more advanced topics, including functions, inequalities, and systems of equations.
You may also be interested in our article on the graph of x 2 which gives various interpretations and meanings of this term, including the related graphs.
To learn more, explore our tutorials on graphing linear equations, understanding vertical and horizontal lines, and how to graph functions in the Graphing Math Functions category.