Graph of linear function: the graph of a linear function is one of the most fundamental concepts in algebra and coordinate geometry. It shows how a straight-line relationship between two variables can be represented visually on a coordinate plane. Understanding how to plot and interpret a linear function and graph helps students and professionals analyze real-world data, such as cost trends, speed, or growth patterns.
Table of Contents
- What Is a Linear Function?
- How to Graph a Linear Function Step-by-Step
- Graph of Linear Function Examples
- Graph of Linear Function Interpretation
- Plot Linear Equation Using Desmos
- Common Mistakes When Graphing Linear Functions
- Tips for Graphing Graph of Linear Function
- Did You Know About the Graph of Linear Function?
- Related Graph Types to Explore
- Frequently Asked Questions About the Graph of Linear Function
- Conclusion
What Is a Linear Function?
A linear function provides a clear, predictable relationship between two variables. It is widely used in mathematics, science, and economics because it allows us to quickly understand trends and make forecasts. By analyzing the slope and intercept of a linear function, we can determine how one variable responds to changes in the other and predict outcomes under various conditions.
A linear function is an equation that describes a straight-line relationship between two variables, typically written as:
where:
- m is the slope (rate of change),
- c is the y-intercept (where the line crosses the y-axis).
This equation of linear function tells us how one variable changes in response to the other.
How to Graph a Linear Function Step-by-Step
Before diving into plotting, it is important to understand what each component of the equation represents and how it affects the line. Knowing the slope and intercept helps you visualize how the line will appear on the graph and ensures accurate plotting from the start.
To plot a linear equation, follow these simple steps:
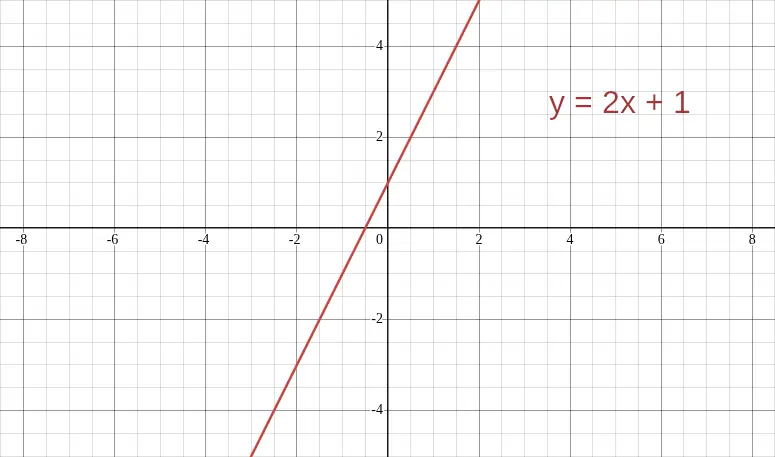
- Write the equation in slope-intercept form: y = mx + c
Example: y = 2x + 1 - Find the y-intercept (c): Plot this point on the y-axis (0,1).
- Use the slope (m): From the intercept, move “rise over run.” For m = 2, go up 2 units and right 1 unit.
- Plot at least two points.
- Draw a straight line through the points — that’s your graph of linear function.
The following image shows the graph of linear function y = 2x + 1 as an example of a graph of a linear function.
Graph of Linear Function Examples
Seeing examples of different linear functions makes it easier to understand how slope and intercept influence the line’s behavior. By comparing multiple graphs, you can observe patterns in steepness, direction, and position on the coordinate plane.
The following are examples of linear graphs and are shown plotted in the image that follows.
| Equation | Slope (m) | Intercept (c) | Line Behavior |
|---|---|---|---|
| y = 2x + 1 | 2 | 1 | Rises steeply upward |
| y = -x + 3 | -1 | 3 | Slants downward |
| y = 0.5x – 2 | 0.5 | -2 | Gentle upward slope |
These examples of linear graphs show that the slope determines the steepness and the intercept shifts the line up or down the graph.

Graph of Linear Function Interpretation
Interpreting a linear graph goes beyond plotting points. It involves understanding the significance of the slope and intercept in context, recognizing trends, and drawing conclusions about the relationship between the variables.
Every linear graphing represents a consistent rate of change:
- If m > 0, the line goes upward (positive correlation).
- If m < 0, the line goes downward (negative correlation).
- If m = 0, the graph is a horizontal line (constant value).
Such relationships are commonly used in economics, physics, and statistics for modeling real data.
Plot Linear Equation Using Desmos
Desmos provides an intuitive way to explore linear functions interactively. Using a digital graphing tool allows you to experiment with slopes and intercepts, instantly seeing how changes to the equation affect the graph, which reinforces conceptual understanding.
Desmos is a free, browser-based graphing calculator that makes it easy to visualize any linear function and graph instantly. It’s an excellent tool for students learning how to plot linear equation relationships accurately.
Steps to Create a Graph of Linear Function in Desmos
Before following the step-by-step instructions, familiarize yourself with Desmos’ interface. The input panel on the left and the graphing grid on the right make it easy to enter multiple equations, manipulate the graph, and explore relationships between lines.
- Go to Desmos Graphing Calculator.
You’ll see an empty coordinate grid and an input panel on the left. - Type your linear equation in the first expression box.
For example, entery = 2x + 1and press Enter — Desmos automatically plots the line. - Adjust the viewing window if needed using the wrench icon to zoom in or out.
This helps you see intercepts or specific data ranges. - Add multiple equations to compare different linear functions and equations.
For instance, tryy = -x + 3ory = 0.5x - 2to see how slope and intercept affect the line. - Label or color-code each line for clarity when showing examples of linear graphs.
You can also click on any line to reveal exact coordinate points.
Desmos automatically draws straight lines for all linear function equations, providing instant feedback and accuracy without manual plotting. It’s one of the fastest and most interactive ways to learn linear graphing online. The following image shows multiple equations plotted using Desmos.

Common Mistakes When Graphing Linear Functions
Even experienced students can make mistakes when graphing linear functions. Being aware of common pitfalls helps ensure accurate and meaningful graphs, whether you are plotting by hand or using software. Here are some of the most common mistakes made when graphing liner functions
- Forgetting to label axes correctly.
- Using inconsistent scales for x and y.
- Misinterpreting slope direction.
- Only plotting one point, a linear function needs at least two.
Tips for Graphing Graph of Linear Function
Careful preparation and attention to detail can make linear graphing much easier. Using these tips ensures your graphs are accurate, visually clear, and correctly represent the relationship between variables.
- Always calculate and plot at least three points to ensure accuracy.
- Extend the line across the visible graph to show continuity.
- Use graph paper or digital grids for precise plotting.
- When comparing linear functions and equations, use color-coded lines.
Did You Know About the Graph of Linear Function?
The earliest recorded study of linear graphing dates back to René Descartes in the 17th century. His invention of the Cartesian coordinate system laid the foundation for how we visualize algebraic equations today, making the graph of linear function one of the oldest and most widely used mathematical tools.
Linear functions have also played a critical role in the development of modern physics and engineering. For example, in mechanics, the relationship between distance and time for objects moving at constant speed can be represented as a linear function. This allows scientists to calculate speed, predict motion, and design transportation systems with precision.
Additionally, linear graphs are commonly used in finance and economics. They help analysts model cost behaviors, forecast revenue trends, and determine the effect of variables like interest rates on investments. Their simplicity and predictability make them indispensable for real-world problem-solving.
Related Graph Types to Explore
Exploring other graph types can expand your understanding of mathematical relationships beyond linear patterns. Each graph type has unique characteristics and applications, showing how changing the form of an equation impacts its visual representation.
- Graph of x² (Quadratic Function)
- Exponential Graphs
- Graphing Linear Inequalities
Each of these expands on the basic principles of linear graphing, showing how changes in the equation shape the curve.
Frequently Asked Questions About the Graph of Linear Function
What is the difference between a linear function and a linear equation?
A linear equation describes a straight-line relationship between two variables and can be written in various forms, such as standard form or slope-intercept form. A linear function, however, emphasizes the dependency of one variable on another, showing how y changes as x changes. While both produce straight lines on a graph, functions specifically follow the rule that each input (x) corresponds to exactly one output (y), which is essential for consistency in real-world modeling.
Can a linear graph be vertical?
No, a vertical line cannot represent a linear function because it violates the rule that each input corresponds to only one output. While the equation x = constant does produce a straight line, it fails the vertical line test for functions, meaning it cannot be expressed as a function of x. Vertical lines are better categorized as special cases of relations, not functions.
How do I find the slope of a linear function from a graph?
To find the slope, select any two points on the line and measure the vertical change (rise) and horizontal change (run) between them. Then divide the rise by the run using the formula: slope = (y₂ – y₁) / (x₂ – x₁). The slope indicates the rate at which y changes relative to x, with positive slopes rising to the right and negative slopes descending.
Pick any two points on the line and calculate:
What are real-life examples of linear functions?
Real-life examples include calculating distance over time at constant speed, budgeting where costs increase at a fixed rate, and temperature conversions between Celsius and Fahrenheit. Linear functions also model depreciation of assets, hourly wage calculations, and predictable growth trends in populations or investments.
Can I plot a linear equation without using software?
Yes, you can plot by hand using graph paper. Identify the y-intercept and plot it on the y-axis, then use the slope to find at least one more point. Draw a straight line through the points to complete the graph. This method is effective for learning the fundamentals of graphing and visualizing relationships without relying on digital tools.
Conclusion
Understanding the graph of linear function is essential for mastering algebra and real-world problem-solving. Whether you plot linear equation points manually or use Desmos, the concept remains the same — a straight line showing constant change. Once you master the linear function and graph, you’ll have a foundation for exploring all types of mathematical functions. See more graphing mathematical functions articles.