If you’ve ever seen a U-shaped curve in a math class, you’ve likely encountered a quadratic function. These functions are central to algebra and appear in everything from physics and engineering to finance and architecture.
In this beginner-friendly guide, we break down what a quadratic is, how to graph it, and how to interpret its features, step by step.
Table of Contents
What Is a Quadratic Function?
A quadratic function is a polynomial function that models situations where change does not happen at a constant rate but instead accelerates or decelerates. Its defining feature is the squared term, which creates a curved graph called a parabola. Quadratic functions appear in physics, engineering, economics, and geometry, making them one of the most practical and widely used mathematical tools.
A quadratic function is a polynomial function of degree 2. It has the general form:
y = ax² + bx + c
Where:
- a, b, and c are constants
- x is the variable
- a ≠ 0
This equation creates a parabola when graphed. The shape and direction of the parabola depend on the value of a.
Key Features of a Quadratic Function Graph
A quadratic graph has a unique set of characteristics that help you understand how the function behaves. These features describe the shape of the parabola, where it turns, how it opens, and how it interacts with the x- and y-axes. Understanding these elements makes it easier to interpret real-world problems or sketch the graph accurately.
When you graph a quadratic function, you’ll notice a curved shape called a parabola. Here are the most important parts of the graph:
1. Vertex
The vertex is the highest or lowest point on the graph, depending on whether the parabola opens down or up. It represents the moment where the direction of the graph switches from increasing to decreasing or vice versa. In real-world applications, the vertex often corresponds to maximum profit, highest point reached in motion, or minimum cost, making it a valuable point to identify.
- If a > 0, the parabola opens upward and the vertex is the minimum.
- If a < 0, it opens downward and the vertex is the maximum.

2. Axis of Symmetry
The axis of symmetry is a vertical line that passes through the vertex and divides the parabola into two mirror-image halves. This line helps you understand how the graph behaves on both sides, and it is always found using the formula x = −b / (2a). Because quadratics are symmetrical, knowing this line helps you plot additional points quickly and check the accuracy of your graph.
A vertical line that passes through the vertex, dividing the graph into two symmetrical halves. Its equation is:
Which can also be typed with keyboard characters as:
x = -b / (2a)
3. Y-Intercept
The y-intercept is the point where the graph crosses the y-axis, occurring when x = 0. This value is always equal to c in the standard form ax² + bx + c, so it’s one of the easiest features to identify. The y-intercept gives you a starting point when sketching and also helps you interpret initial values in real-world scenarios.
4. X-Intercept(s) or Roots
The x-intercepts, also called roots or solutions, are the points where the graph touches or crosses the x-axis. These occur when the quadratic function equals zero, and they can be found by factoring, completing the square, or using the quadratic formula. The nature of the roots (two, one, or none) provides insight into how the parabola interacts with the x-axis.
How to Graph a Quadratic Function
Graphing a quadratic function involves identifying key features, plotting strategic points, and sketching the curve that represents the function. Once you understand how the vertex, axis of symmetry, and intercepts work together, drawing the parabola becomes much easier and more intuitive.
Let’s walk through how to graph a simple quadratic function.
Example
y = x² – 4x + 3
Step 1: Identify a, b, and c
Before graphing, start by identifying the coefficients a, b, and c from your quadratic equation in standard form (y = ax² + bx + c). These values determine the shape and position of the parabola. The sign of a tells you whether the graph opens upward or downward, while b influences the direction of the graph near the vertex, and c gives the y-intercept. Clearly identifying these values ensures that every calculation that follows—vertex, intercepts, table of values, will be accurate and consistent with your example.
- a = 1
- b = -4
- c = 3
Step 2: Find the Vertex
Once you know a, b, and c, use them to calculate the vertex, which is the turning point of the parabola. Start by finding the x-coordinate using the formula x = −b / (2a). Then substitute this x-value back into the original quadratic equation to determine the corresponding y-coordinate. Together, these two values give you the precise location of the vertex. Because the vertex shows where the function reaches its maximum or minimum, it serves as the anchor point for shaping the rest of the graph.
Use the formula:x = -b / (2a) → x = -(-4) / (2 × 1) = 2
Now plug x = 2 back into the equation to find y:y = (2)² - 4(2) + 3 = 4 - 8 + 3 = -1
So the vertex is at (2, -1)
Step 3: Find the Y-Intercept
The y-intercept is the easiest key feature to determine because it occurs where x = 0. Simply substitute 0 into the quadratic equation, which reduces directly to y = c. This gives you a guaranteed point to plot on your graph and helps you see how the parabola behaves near the vertical axis.
Let x = 0:y = 0² - 4(0) + 3 = 3
So the y-intercept is at (0, 3)
Step 4: Find the X-Intercepts
The x-intercepts, also known as the roots or solutions, occur where y = 0. To find them, set the entire quadratic equal to zero and solve using the method appropriate for your example (factoring, completing the square, or the quadratic formula). These values tell you where the graph crosses the x-axis, and they play an important role in shaping the width and direction of the parabola. Depending on the discriminant, you may find two real intercepts, one real intercept (a tangent point), or none at all. Your example will dictate exactly how this step plays out.
Factor the equation:y = x² - 4x + 3 = (x - 1)(x - 3)
Set y = 0:(x - 1)(x - 3) = 0 → x = 1 or x = 3
So the x-intercepts are at (1, 0) and (3, 0)
Step 5: Plot the Graph
Now that you have the vertex, y-intercept, x-intercepts, and coefficients, you can begin sketching the complete graph. Start by plotting the vertex, then mark the intercepts, and use symmetry, based on the axis of symmetry passing through the vertex, to reflect points across the graph. Plot a few additional x-values to create a smooth curve that reflects the true shape of the quadratic from your example. Finally, connect all points with a clean, rounded curve that accurately represents the behavior of the function.
Plot the vertex, x-intercepts, and y-intercept, then draw the symmetrical U-shaped parabola.

How to Plot a Quadratic Function in Desmos
Plotting a quadratic function in Desmos is an easy and visual way to understand how the graph behaves. Desmos automatically generates the curve, highlights key features, and updates the graph instantly as you adjust the equation. This makes it especially helpful for checking your work or experimenting with different values of a, b, and c to see how they affect the parabola.
Step 1: Open Desmos
Go to the Desmos Graphing Calculator. You can use the web version or the mobile app—both work the same way for graphing quadratics.
Step 2: Enter the Quadratic Equation
In the first expression box, type your quadratic function in standard form, such as:y = ax^2 + bx + c
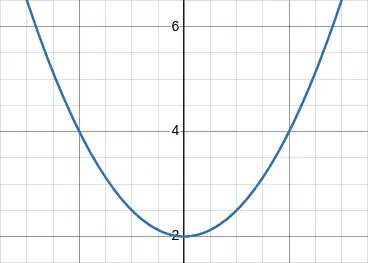
As soon as you enter the equation, Desmos will automatically display the parabola on the graph. For example:
Which is entered in Desmos as:
y = 2x^2 + 4x + 1Step 3: Add Sliders for a, b, and c (Optional but Helpful)
Prompts for sliders appear when entering the standard equation as:
y = ax^2 + bx + cDesmos allows you to create sliders for the coefficients. After typing your equation, click on each letter (a, b, c) and choose Add Slider. You can now drag the sliders to see instantly how changing each value affects the shape and position of the graph.
Step 4: Identify the Vertex, Intercepts, and Axis of Symmetry
Click any point on the curve, and Desmos will show its coordinates. You can also type helper expressions, such as:
x = -b/(2a)to show the axis of symmetry0 = ax^2 + bx + cto find roots numericallyy = cto confirm the y-intercept
Desmos updates everything in real time, making it easy to check your manual calculations.
Step 5: Zoom and Adjust the View
Use your mouse or touchpad to zoom in or out. This helps you see the intercepts clearly or explore how steep the graph becomes when a changes. You can also drag the graph to reposition it for better viewing.
Step 6: Compare Multiple Quadratic Functions
If you want to compare different quadratics, simply add additional equations in the next expression lines. Desmos color-codes each graph automatically, making it simple to see how different values of a, b, and c affect each curve.

Real-Life Examples
Quadratic functions appear far more often in everyday life than most people realize. Any situation involving curved motion, balanced optimization, or squared relationships can be modeled with a parabola. These examples help bridge the gap between the abstract equation and real-world applications you can visualize or even experience firsthand. Whether an object is launched into the air, a company is maximizing profit, or engineers are designing safe structures, quadratic models allow us to predict outcomes, find optimal values, and understand how variables interact.
Quadratic functions show up in many real-world situations, such as:
- The path of a thrown ball (projectile motion)
- Revenue optimization problems in business
- Satellite dish or suspension bridge curves
- Acceleration in physics
These practical applications make learning quadratic functions essential for many careers.
Solving a Quadratic Function
Solving a quadratic function means finding the x-values that make the function equal zero. These solutions reveal where the graph crosses the x-axis and often help solve real-life problems involving motion, optimization, or area calculations.
You can solve quadratic functions by:
1. Factoring
Factoring is the most straightforward method when the quadratic can be broken into two simple binomials. Once factored, setting each factor equal to zero gives you the solutions. This method is fast but only works when the quadratic is “factor-friendly.”
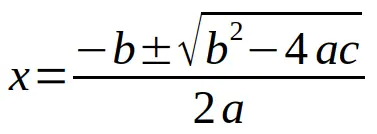
2. Quadratic Formula
The quadratic formula,
x = [−b ± √(b² − 4ac)] / (2a),
is the most powerful and universal method because it works for every quadratic function. It not only provides the solutions but also tells you whether they are real or complex based on the discriminant.
Always works, even when factoring doesn’t:
x = [-b ± √(b² - 4ac)] / (2a)
3. Completing the Square
Completing the square rewrites the quadratic in vertex form, allowing you to isolate the squared term and take square roots directly. This method is reliable for any quadratic and also reveals the vertex, which is useful for graphing and analysis. Useful in deriving the vertex form or solving certain types of quadratics.
Quadratic Function vs. Linear Function
A quadratic function produces a curved graph with a changing rate of change, while a linear function creates a straight line with a constant rate. This difference dramatically affects how each graph behaves. Linear functions model steady growth or decline, whereas quadratic functions model situations where growth accelerates, slows down, or reverses direction.
| Feature | Quadratic Function | Linear Function |
|---|---|---|
| Equation Format | y = ax² + bx + c | y = mx + b |
| Graph Shape | Parabola (U-shaped curve) | Straight line |
| Degree | 2 | 1 |
| Roots (x-intercepts) | Up to 2 | 1 (unless horizontal) |
Frequently Asked Questions (FAQ)
What is the shape of a quadratic function graph?
It forms a parabola, which can open upward or downward depending on the value of a in the equation.
Can a quadratic function have no real x-intercepts?
Yes. If the discriminant (b² – 4ac) is negative, the graph doesn’t cross the x-axis and has no real solutions.
How do you find the vertex of a quadratic function?
Use the formula x = -b / (2a) and substitute into the equation to find the corresponding y-value.
What is the difference between standard form and vertex form?
Standard form is y = ax² + bx + c; vertex form is y = a(x - h)² + k, where (h, k) is the vertex.
Quadratic Function Conclusion
Understanding quadratic functions is a foundational step in mastering algebra and preparing for higher-level math. Their graphs provide visual insights into how variables change and interact. Whether you’re a student or brushing up on math concepts, learning to graph and interpret quadratics will serve you well in academics and beyond.
You may also be interested in other graphing math functions.