When someone searches for graph of x 2, they are usually looking for the graph of x² (or x^2), which represents the equation y = x². This is one of the most fundamental graphs in algebra, a parabola that opens upward and is symmetrical around the y-axis.
However, the phrase “graph of x 2” can also refer to other possible meanings like graph x=2, graph of 2x, or even graph 2 x 2. This article explains each of these interpretations in clear, visual terms.
Table of Contents
- Graph of x 2 — The Most Common Meaning: The Graph of x²
- How to Graph x² Step-by-Step
- Other Interpretations of “Graph of x 2”
- Common Mistakes When Graphing x²
- Tips for Graphing x² (Graph of x 2)
- Did You Know About the Graph of x² (Graph of x 2)?
- Frequently Asked Questions About the Graph of x 2
- Graph Types Related to Graph of x 2 to Explore
- Conclusion on the Graph of x 2
Graph of x 2 — The Most Common Meaning: The Graph of x²
The graph of x² is a cornerstone in algebra, often the first parabola students encounter. It visually represents the squared relationship between x and y, making it easy to see how small changes in x produce increasingly larger values of y. Because y = x² always produces non-negative values, the curve starts at the origin and rises symmetrically on both sides, creating a smooth, U-shaped figure. Understanding this graph helps build intuition for more complex quadratic functions and their transformations.
The graph of x² shows the relationship between x and y when y equals x squared. As x increases or decreases, y grows rapidly because of the squaring operation.
| x | y = x² |
|---|---|
| -3 | 9 |
| -2 | 4 |
| -1 | 1 |
| 0 | 0 |
| 1 | 1 |
| 2 | 4 |
| 3 | 9 |

This set of points forms a U-shaped curve, known as a parabola. The vertex (lowest point) is at (0, 0). The curve opens upward, and it is symmetrical along the y-axis.
How to Graph x² Step-by-Step
Graphing x² is straightforward once you understand the pattern of the values. By plotting points where x ranges from negative to positive numbers and calculating the corresponding y-values, you can see the symmetry and growth of the parabola clearly. This step-by-step approach ensures accuracy and helps reinforce the relationship between algebraic expressions and their visual representations on a coordinate plane.
- Create a table of values for x and calculate y = x².
- Plot the points (x, y) on a coordinate plane.
- Connect the points smoothly to form a U-shaped parabola.
- Label the vertex at (0, 0).
- Draw the axis of symmetry — the y-axis divides the graph perfectly in half.
This process gives you the graph of x², one of the most recognizable graphs in mathematics.
Other Interpretations of “Graph of x 2”
When people search for “graph of x 2,” they may not always mean the standard y = x² parabola. Depending on context, the phrase could refer to several different mathematical interpretations. Recognizing these variations is important for correctly reading or plotting graphs, especially when working in programming, statistics, or other applied fields.
People searching for graph of x 2 may mean several different mathematical graphs. Here’s what each version represents:
1. Graph x = 2
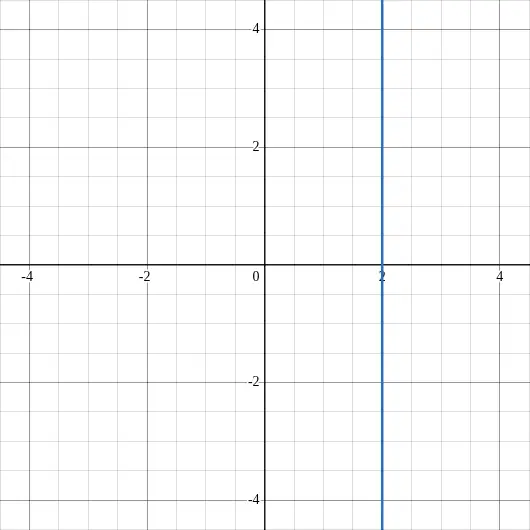
The graph x = 2 is a simple vertical line that passes through the x-axis at 2. Unlike the curved parabola of y = x², this line shows all points where x remains constant regardless of y. It’s a useful concept in understanding vertical lines, constraints in equations, and plotting boundaries on a graph.
The graph x=2 is a vertical straight line crossing the x-axis at 2. Also see the graph of x 1, or graph of x = 1.
- It shows all points where x stays constant at 2, and y can be any value.
- Unlike graph of x², which is curved, graph x=2 is perfectly vertical.
2. Graph x^2
Graph x^2 is essentially a different notation for the same parabola as y = x². This form is commonly used in programming languages, spreadsheets, and calculators where the caret (^) indicates exponentiation. Recognizing this notation helps avoid confusion when translating between written mathematics and digital tools.
This is another way to write graph of x². The caret (^) symbol is often used in programming or calculators to represent exponents. So, graph x^2 means exactly the same as graph of x².
3. Graph 2x (2 x Graph)
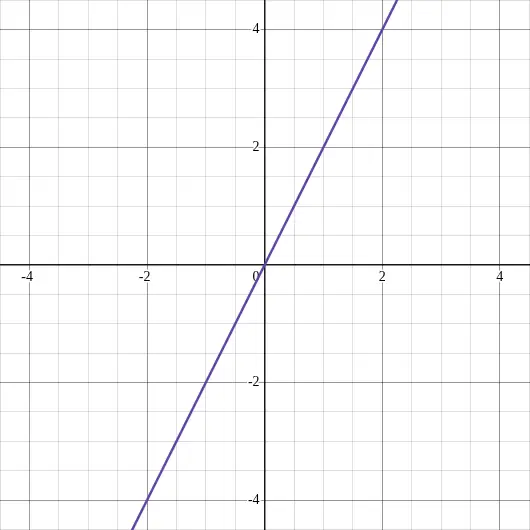
The 2x graph represents a linear function where each x-value is doubled to calculate y. This straight line passes through the origin with a slope of 2, illustrating constant growth rather than the accelerated growth seen in quadratic functions. Comparing this graph to y = x² highlights the differences between linear and quadratic relationships.
The 2 x graph, or graph of y = 2x, is a straight line through the origin with a slope of 2.
- It doubles every x-value to get y.
- Unlike the graph of x², this line does not curve.
4. Graph 2 x 2 / Graph of 2 x 2
Sometimes, the phrase “graph 2 x 2” does not describe a function at all but rather refers to a 2×2 matrix or a grid. This interpretation is common in statistics, computer science, and data visualization. For example, it may represent a table of values, a simple quadrant plot, or other small-scale visualizations used for organizing data.
Sometimes, graph 2 x 2 refers not to a function but to a 2×2 grid or matrix.
- This appears in statistics, computer science, and data visualization.
- For example, a “2×2 graph” might represent a table or a grid of four quadrants.
Common Mistakes When Graphing x²
A common pitfall is overlooking the negative side of x-values. Since x² is symmetrical, failing to plot negative x-values will result in an incomplete graph. Another frequent error is connecting plotted points with straight lines instead of a smooth curve, which distorts the shape of the parabola. Being mindful of axis scaling and differentiating x² from linear functions like y = 2x ensures your graph accurately represents the mathematical relationship.
- Forgetting negative x-values: The parabola is symmetrical, so both sides matter.
- Connecting points with straight lines: The graph should be a smooth curve.
- Using uneven scaling: If the x- and y-axes aren’t properly scaled, the shape becomes distorted.
- Mixing up x² with 2x: These represent completely different functions.
Tips for Graphing x² (Graph of x 2)
To create precise and clear graphs of x², always plot equal positive and negative x-values. This balance makes the symmetry of the parabola immediately apparent. Using graph paper or digital tools like Desmos or GeoGebra can simplify the plotting process and provide an accurate visual reference. Additionally, labeling axes and the vertex helps avoid confusion when comparing different graphs or explaining your work to others.
- Always plot equal positive and negative x-values for balance.
- The vertex (0, 0) is your symmetry center.
- Use graph paper or digital tools like Desmos or GeoGebra for precision.
- Compare the graph of x² with y = 2x² or y = ½x² to see how steepness changes.
- Label axes clearly to avoid confusion with similar graphs like graph x=2 or graph 2 x 2.
Did You Know About the Graph of x² (Graph of x 2)?
The graph of x² is the foundation for all quadratic functions. By changing coefficients, you can transform it into any parabola:
- y = a(x – h)² + k shifts, stretches, or compresses the curve.
The word parabola comes from the Greek word meaning “application,” used by ancient mathematicians to describe geometric constructions. Parabolas are now used in satellite dishes, headlights, and projectile motion equations.
Frequently Asked Questions About the Graph of x 2
What does the graph of x² look like?
It’s a U-shaped parabola centered at (0, 0) that opens upward.
How is graph x=2 different from graph of x²?
Graph x=2 is a vertical line, while graph of x² is a curved parabola.
What does graph x^2 mean?
It’s another way of writing “graph of x²” using the caret symbol for exponents.
What is the equation for the graph of x²?
The equation is y = x². For each x, square it to get y.
What is the vertex of the graph of x²?
The vertex is at (0, 0), the lowest point on the graph.
How do you graph 2x?
The graph of y = 2x is a straight line through the origin with a slope of 2.
What is graph 2 x 2 used for?
It often refers to a 2×2 matrix or grid, used in statistics or data visualization, not a function graph.
How is y = 2x² related to y = x²?
y = 2x² grows faster — it’s a steeper version of the original parabola.
Graph Types Related to Graph of x 2 to Explore
Once you are comfortable with the basic parabola, exploring related graph types deepens understanding of function behavior. Cubic functions, absolute value functions, and square root functions each offer unique patterns and growth rates. Linear functions like y = 2x provide a useful contrast to quadratic curves, helping highlight the differences between steady and accelerated change across a coordinate plane.
- Graph of y = x³: Understanding Cubic Functions
- The graph of y = |x|: The Absolute Value Function
- Graph of y = √x: The Square Root Function
- Graph of y = 2x: Linear Growth Explained
Conclusion on the Graph of x 2
The graph of x² is the most common interpretation of “graph of x 2,” representing the basic quadratic parabola y = x². However, depending on context, it could also mean graph x=2, graph x^2, 2 x graph, or graph 2 x 2. Understanding the differences between these helps you read, draw, and interpret mathematical graphs correctly.
Mastering the graph of x² gives you a foundation for more complex graphing concepts in algebra and beyond.
To learn more, explore our tutorials on graphing linear equations, understanding vertical and horizontal lines, and how to graph functions in the Graphing Math Functions category.